ExamineAI
First page of ZIMSEC O-Level Physics Paper 4 June 2005 Question Paper

ZIMSEC O-Level Physics Paper 4 June 2005 Question Paper

Download and practise with this ZIMSEC O-Level Physics Paper 4 June 2005 question paper. Useful for exam revision, past paper practice, and preparation in Zimbabwe.

A free account is needed to download. Sign in or create one

Exam board
ZIMSEC
Subject
Physics
Level
O-Level
Document
Question Paper
Paper
Paper 4
Time allowed
60 minutes
Session
June
Year
2005
File
PDF, 3.2 MB

About this question paper

This is the ZIMSEC O-Level Physics question paper for Paper 4 from June 2005. Use it for exam practice under timed conditions. Time allowed: 60 minutes.

Other years: Physics O-Level

Text from the first page

5

It is recommended that you spend about 60 minutes on this question.
2 In this experiment you will be required to calibrate a thermistor and use it to determine the melting point of ethanoic acid.
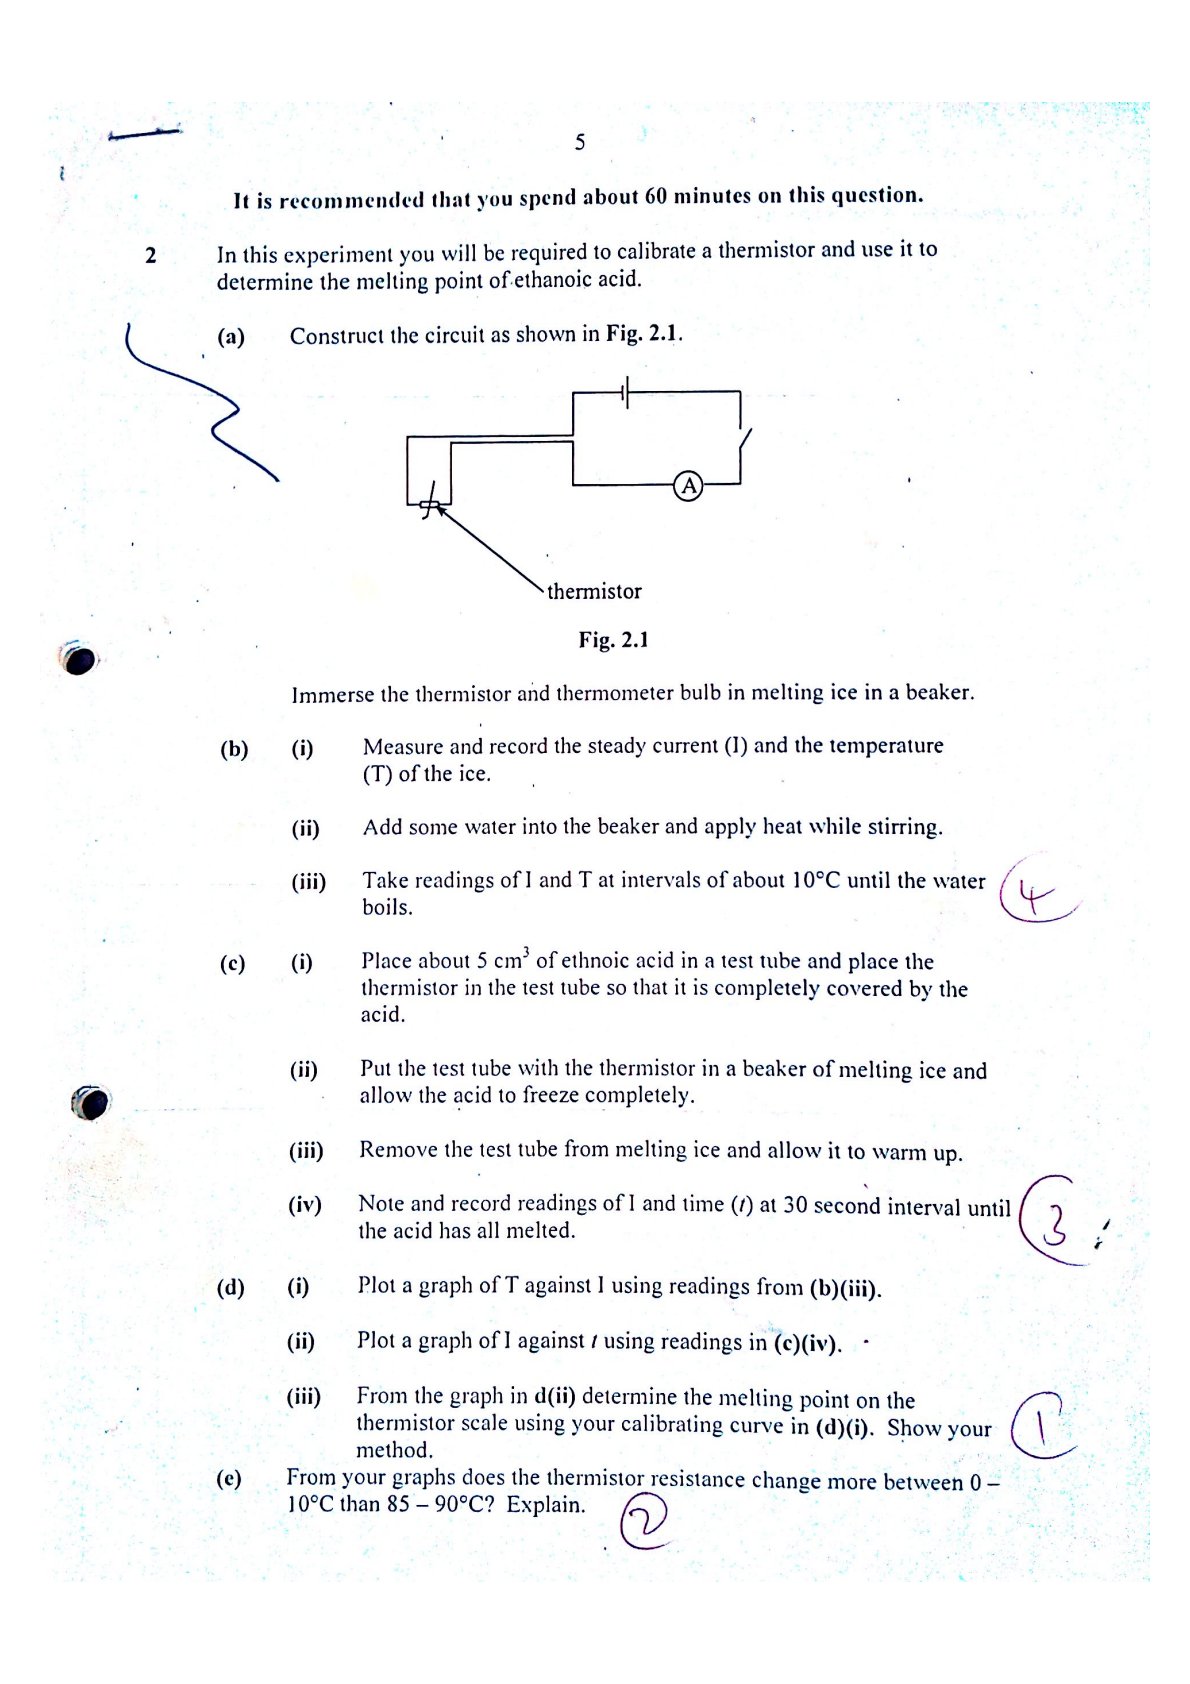
(a) Construct the circuit as shown in Fig. 2.1.

Fig. 2.1

Immerse the thermistor and thermometer bulb in melting ice in a beaker.
(b) (i) Measure and record the steady current (I) and the temperature (T) of the ice.
(ii) Add some water into the beaker and apply heat while stirring.
(iii) Take readings of I and T at intervals of about $10^{\circ} \mathrm{C}$ until the water boils.

4
(c) (i) Place about $5 \mathrm{~cm}^{3}$ of ethnoic acid in a test tube and place the thermistor in the test tube so that it is completely covered by the acid.
(ii) Put the test tube with the thermistor in a beaker of melting ice and allow the acid to freeze completely.
(iii) Remove the test tube from melting ice and allow it to warm up.
(iv) Note and record readings of I and time ( $t$ ) at 30 second interval until the acid has all melted.

$32 ;$
(d) (i) Plot a graph of T against I using readings from (b)(iii).
(ii) Plot a graph of I against $t$ using readings in (c)(iv). -
(iii) From the graph in d(ii) determine the melting point on the thermistor scale using your calibrating curve in (d)(i). Show your method.

I
(e) From your graphs does the thermistor resistance change more between 0 $10^{\circ} \mathrm{C}$ than $85-90^{\circ} \mathrm{C}$ ? Explain.

(2)