ExamineAI
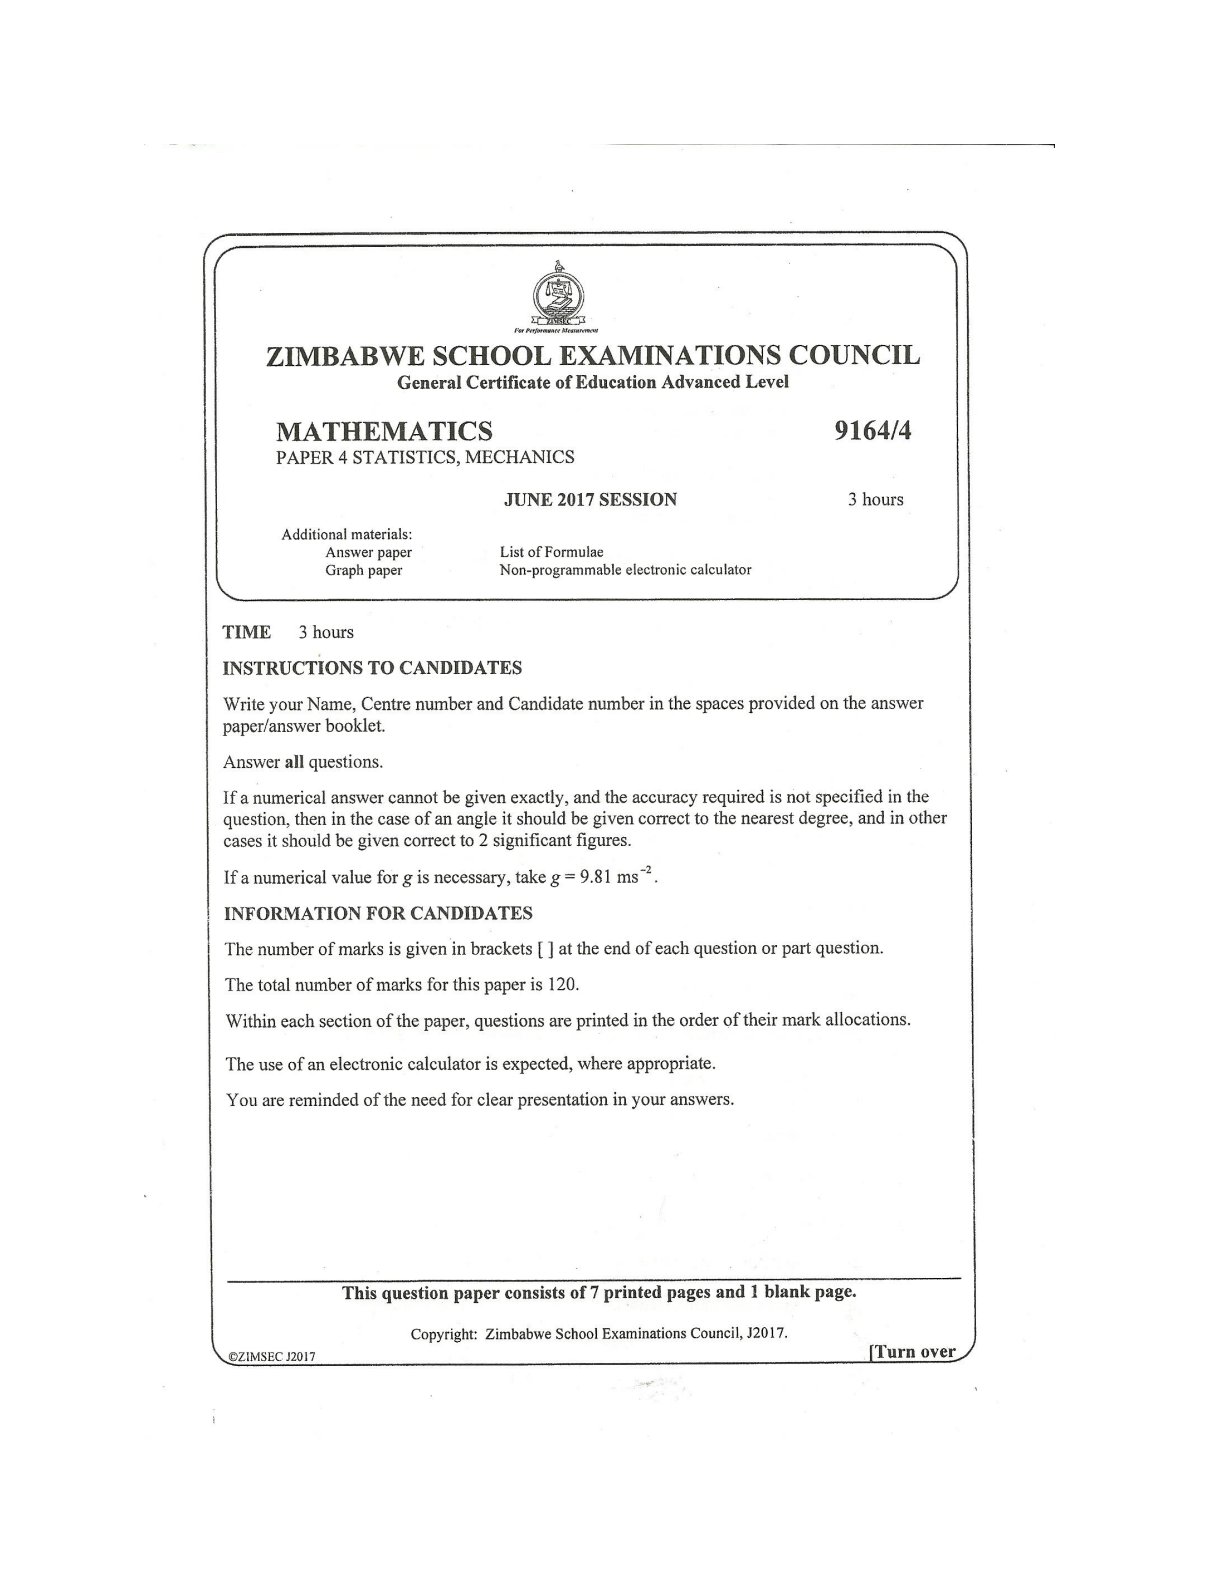
First page of ZIMSEC A-Level Mathematics Paper 4 June 2017 Question Paper

ZIMSEC A-Level Mathematics Paper 4 June 2017 Question Paper

Download and practise with this ZIMSEC A-Level Mathematics Paper 4 June 2017 question paper. Useful for exam revision, past paper practice, and preparation in Zimbabwe.

A free account is needed to download. Sign in or create one

Answers: ZIMSEC A-Level Mathematics Paper 4 June 2017 Marking Scheme

Exam board
ZIMSEC
Subject
Mathematics
Level
A-Level
Document
Question Paper
Paper
Paper 4
Paper code
9164/4
Time allowed
3 hours
Session
June
Year
2017
File
PDF, 1.7 MB

About this question paper

This is the ZIMSEC A-Level Mathematics question paper for Paper 4 from June 2017. Use it for exam practice under timed conditions, then check your work against the marking scheme. The paper code is 9164/4. Time allowed: 3 hours. See the marking scheme.

More Mathematics A-Level 2017 papers

Other years: Mathematics A-Level

Extracted text

# ZIMBABWE SCHOOL EXAMINATIONS COUNCIL <br> General Certificate of Education Advanced Level

## MATHEMATICS <br> PAPER 4 STATISTICS, MECHANICS

9164/4

JUNE 2017 SESSION
3 hours

Additional materials:
Answer paper
Graph paper

List of Formulae
Non-programmable electronic calculator

TIME 3 hours

### INSTRUCTIONS TO CANDIDATES

Write your Name, Centre number and Candidate number in the spaces provided on the answer paper/answer booklet.

Answer all questions.
If a numerical answer cannot be given exactly, and the accuracy required is not specified in the question, then in the case of an angle it should be given correct to the nearest degree, and in other cases it should be given correct to 2 significant figures.

If a numerical value for \(g\) is necessary, take \(g=9.81 \mathrm{~ms}^{-2}\).

### INFORMATION FOR CANDIDATES

The number of marks is given in brackets [ ] at the end of each question or part question.
The total number of marks for this paper is 120.
Within each section of the paper, questions are printed in the order of their mark allocations.
The use of an electronic calculator is expected, where appropriate.
You are reminded of the need for clear presentation in your answers.

This question paper consists of 7 printed pages and 1 blank page.

Copyright: Zimbabwe School Examinations Council, J2017.

**Section A: Statistics**

## Question 1
Given that X is a discrete random variable, such that \(\mathrm{X} \sim \operatorname{Geo}(0.4)\), find

### (a)

\(\quad \mathrm{P}(\mathrm{X} \leq 7)\),

### (b)

\(\quad \mathrm{P}(\mathrm{X}>8 \mid \mathrm{X}>3)\).

## Question 2
A survey on 2000 students at a certain university has shown that on average one in every 500 students at that university catches a cold in a week.

Use a suitable approximation to find the probability that

### (a)

exactly one student catches a cold in a week.,

### (b)

at least three students catch a cold in a month, assuming that the month has exactly 28 days.

## Question 3
Below are marks obtained by a group of 36 advanced level students of a certain school in a Mathematics test.

| 59 | 53 | 74 | 55 | 90 | 57 |
| :--- | :--- | :--- | :--- | :--- | :--- |
| 88 | 68 | 59 | 67 | 82 | 62 |
| 61 | 77 | 74 | 86 | 60 | 83 |
| 92 | 58 | 60 | 72 | 57 | 96 |
| 56 | 67 | 73 | 78 | 66 | 79 |
| 51 | 60 | 54 | 67 | 80 | 63 |

### (a)

Construct a stem and leaf diagram to illustrate the distribution of the marks, such that each class interval has a width of 5 marks.

### (b)

Find the

#### (i)

median mark,

#### (ii)

interquartile range.

## Question 4
The continuous random variable \(X\) has a probability density function given by

$$
f(x)= \begin{cases}2 e^{-k x}  |  x \geq 0  0  |  x<0\end{cases}
$$

where \(k\) in an integer.

### (a)

Show that \(k=2\).

### (b)

Find the

#### (i)

cumulative distribution function of X ,

#### (ii)

exact value of the median.

## Question 5
The random variable X is normally distributed with mean \(\mu\) and variance \(\sigma^{2}\).
Given that \(\mathrm{P}(\mathrm{X}>65)=0.01\) and \(\mathrm{P}(\mathrm{X}<20)=0.02\),
find \(\mu\) and \(\sigma\).

## Question 6
The discrete random variable X is distributed as shown in the table below.

| X | 0 | 1 | 2 | 3 | 4 |
| :---: | :---: | :---: | :---: | :---: | :---: |
| Frequency | 46 | 44 | 20 | 8 | 2 |

### (a)

Calculate the mean value of X .

### (b)

#### (i)

Find the frequencies that would correspond to a Poisson model with the same mean.

#### (ii)

Test at the \(5 \%\) level of significance whether the data follows a Poisson distribution with the same mean.

## Question 7
An agriculture class decided to test three new types of fertilizer \(\mathbf{X}, \mathbf{Y}\) and \(\mathbf{Z}\) on the bean crop in the school garden. They applied the fertilizers to 75 beds of bean plants. The yield per bed of beans was classified as high, medium or low.

The results are summarised in the table below.

| Yield | Type of fertiliser |  |  |
| :--- | :---: | :---: | :---: |
|  | \(\mathbf{X}\) | \(\mathbf{Y}\) | \(\mathbf{Z}\) |
| High | 12 | 15 | 3 |
| Medium | 8 | 8 | 8 |
| Low | 5 | 7 | 9 |

Test at the \(1 \%\) level of significance whether there is an association between type of fertilizer and yield.

## Question 8
The random variables, R and S , are both normally distributed. Given that \(R \sim N(54,36)\) and \(S \sim N(48,25)\).

### (a)

Find

#### (i)

the values of r and s such that \(\mathrm{P}(\mathrm{R} \leq r)=\mathrm{P}(\mathrm{S} \geq s)=0.484\),

#### (ii)

\(\quad \mathrm{P}(\mathrm{R} \geq \mathrm{S})\).

### (b)

Six independent observations of R are taken.

Find the probability that the sum of the six observations is less than 300 .

## Question 9
The marks \(x\), obtained by a random sample of \(n\) students in a test are summarised by \(\sum(x-25)=144\) and \(\sum(x-25)^{2}=3650\).

### (a)

Given that \(\bar{x}=28.6\), find the

#### (i)

value of \(n\),

#### (ii)

\(\quad \sum x^{2}\),

#### (iii)

unbiased estimate of the population variance.

### (b)

Calculate a 99\% confidence interval for the population mean.

### (c)

Given that the sample came from a Normal population with mean \(\mu=30\) and unknown variance, test at the \(5 \%\) level of significance the hypothesis that the mean is less than 30 .

## Question 10
Marks, \(X\) and \(Y\) obtained by each of ten candidates in Mathematics are given in the table below. X is the mark for paper 1 and Y is the mark obtained by the candidate in paper 2.

| X | 86 | 93 | 73 | 66 | 88 | 96 | 80 | 70 | 95 | 63 |
| :--- | :--- | :--- | :--- | :--- | :--- | :--- | :--- | :--- | :--- | :--- |
| Y | 71 | 76 | 61 | 52 | 75 | 94 | 71 | 60 | 85 | 55 |

### (a)

Show the information on a scatter diagram.

### (b)

Find the equation of the regression line Y on X in the form \(y=m x+c\).

### (c)

Fit the regression line on the graph.

### (d)

Use the graph to estimate the paper 2 mark for a candidate who has a paper 1 mark of 75 .

### (e)

#### (i)

Calculate the product …