ExamineAI
First page of ZIMSEC A-Level Geography Paper 3 June 2024 Question Paper

ZIMSEC A-Level Geography Paper 3 June 2024 Question Paper

Download and practise with this ZIMSEC A-Level Geography Paper 3 June 2024 question paper. Useful for exam revision, past paper practice, and preparation in Zimbabwe.

A free account is needed to download. Sign in or create one

Exam board
ZIMSEC
Subject
Geography
Level
A-Level
Document
Question Paper
Paper
Paper 3
Paper code
0017/3
Session
June
Year
2024
File
PDF, 259 KB

About this question paper

This is the ZIMSEC A-Level Geography question paper for Paper 3 from June 2024. Use it for exam practice under timed conditions. The paper code is 0017/3.

More Geography A-Level 2024 papers

Other years: Geography A-Level

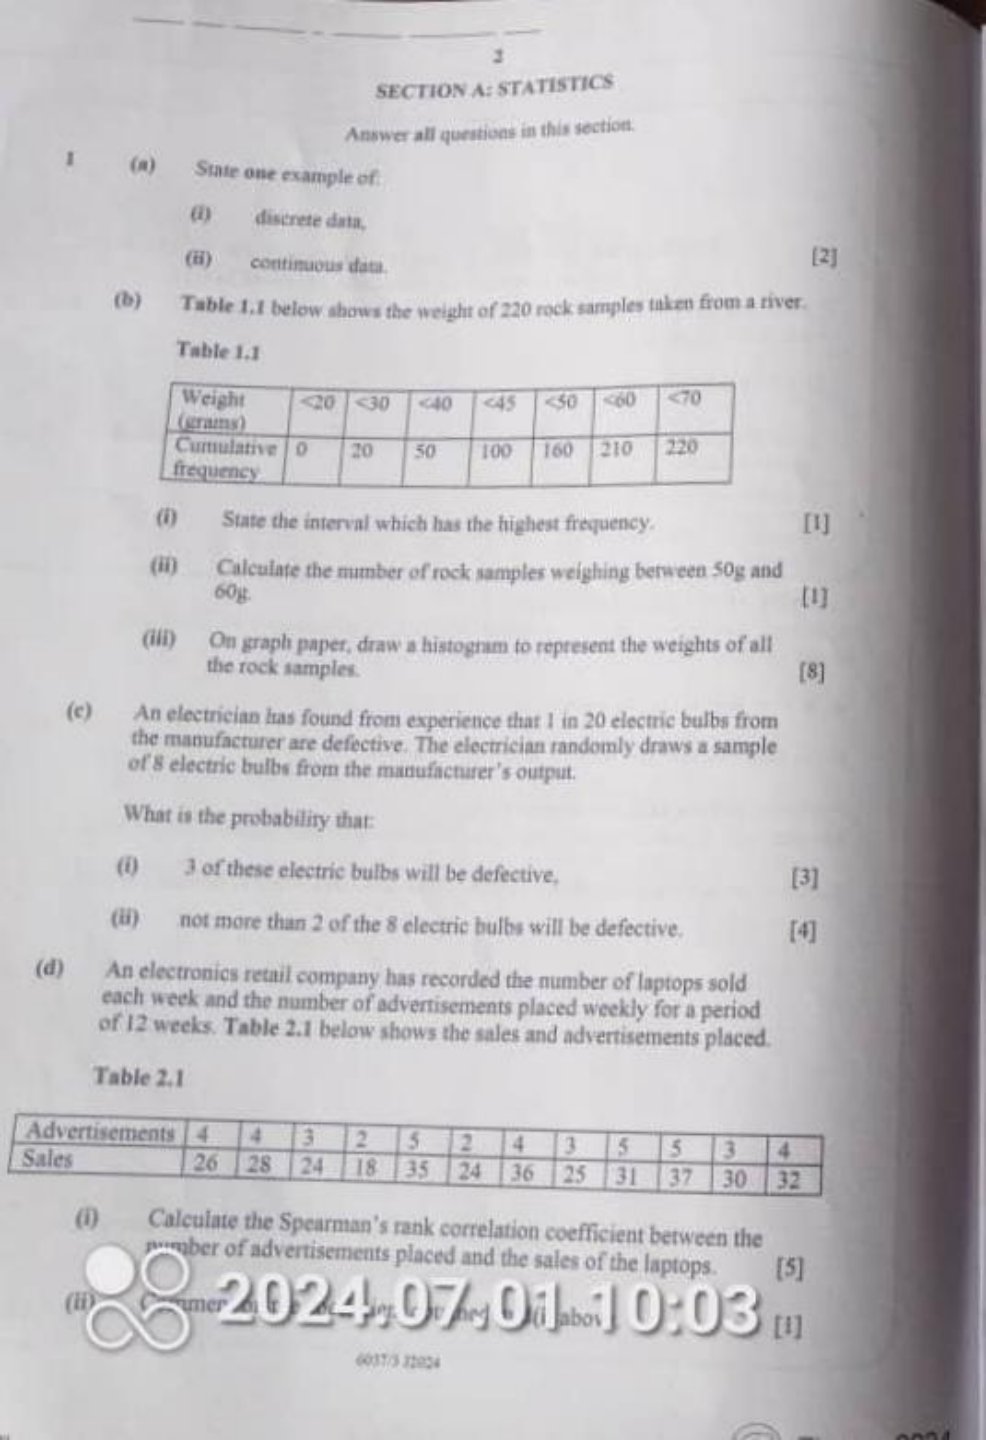
Text from the first page

SECTION A: STATISTICS
Answer all questions in this section.
1 (a) State one example of:
(i) discrete data,
(ii) continuous data.

[2]
(b) Table 1.1 below shows the weight of 220 rock samples talan from a river.

\begin{table}
\captionsetup{labelformat=empty}
\caption{Table 1.1}

Weight
(erauns)
  |  $<20$  |  $<30$  |  $<40$  |  $<45$  |  $<50$  |  $<00$  |  $<70$

Curmulative
fiequency
  |  0  |  20  |  50  |  100  |  160  |  210  |  220

\end{table}
(i) State the interval which has the highest frequency.

[I]
(ii) Calculate the number of rock sampler weighing berween 50 g and 60 g .

[1]
(iii) On graph paper, draw a histogram to represent the weights of alf the rock samples.

[8]
(c) An electrician has found from experience that 1 in 20 electric bulbs from the manufacturer are defective. The electrician randomly draws a sample of' 8 electric bulbs from the manufacturer's output.
What is the probability that:
(i) 3 of these electric bulbs will be defective,

[3]
(ii) not more than 2 of the 8 electric buths witt be defective.

[4]
(d) An electronics retail company has recorded the number of laptops sold each week and the number of advertisements placed weekly for a period of 12 weeks. Table 2.1 below shows the sales and advertisements placed.
Table 2.1

 Advertisements  |  4  |  4  |  3  |  2  |  5  |  2  |  4  |  3  |  5  |  5  |  3  |  4
 Sales  |  26  |  28  |  24  |  18  |  35  |  24  |  36  |  25  |  31  |  37  |  30  |  32

(i) Calculate the Spearman's rank correlation coefficient between the number of advertisements placed and the sales of the laptops.

[5]
(0017/3 HED4